


Next: Conclusion from NA44 strangeness
Up: Inclusive single particle results
Previous: Subtleties and controversies related
Contents
Kopytine's homepage
As far as the motivation for studying kaon production is concerned,
the following points can summarize the discussion :
-
Because kaons are the lightest (and therefore the most abundant)
strange particles, the
strangeness content of the final state can not be understood without
measuring kaons.
-
On the other hand, the kaon abundance alone does not permit to draw
conclusions about presence or absence of the deconfined phase in the
evolution of the system.
For the former reason, and in the light of the latter caveat,
we have carried out a study of kaon production in  collisions at SPS
[26].
collisions at SPS
[26].
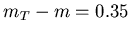
Tables 5.1 and 5.2 give the
 slope parameters
and values of
slope parameters
and values of  for kaons and pions.
The measured distributions for charged kaons
of both signs in transverse kinetic energy and
rapidity, are shown on Fig. 5.1
for kaons and pions.
The measured distributions for charged kaons
of both signs in transverse kinetic energy and
rapidity, are shown on Fig. 5.1
Table 5.1:
Inverse slope parameters T.
| PID |
 interval interval |
 (MeV) (MeV) |
 stat., syst. (MeV) stat., syst. (MeV) |
 |
2.3-2.6 |
230 |
 8 14 8 14 |
|
2.4-2.9 |
254 |
4 7 |
 |
2.3-2.6 |
259 |
8 12 |
|
2.4-2.9 |
245 |
7 6 |
|
Table 5.2:
Particle distributions in rapidity for top 4% centrality.
Every spectrometer setting
provides an independent measurement. Settings overlapping in
are listed separately.
Statistical and systematic errorbars are added in quadrature to form
 listed.
| PID |
interval |
 |
|
PID |
interval |
|
|
|
2.7-2.9 |
21.5 |
7.5 |
|
2.7-2.9 |
37.1 |
5.4 |
| |
2.3-2.5 |
18.7 |
1.9 |
|
2.3-2.6 |
27.2 |
2.5 |
| |
3.1-3.4 |
15.4 |
4.1 |
|
3.1-3.4 |
29.7 |
5.6 |
| |
2.6-2.8 |
14.8 |
1.4 |
|
2.6-2.8 |
33.6 |
3.1 |
 |
3.3-3.7 |
176 |
14 |
 |
3.3-3.7 |
160 |
15 |
| |
2.6-2.9 |
193 |
12 |
|
2.6-2.9 |
153 |
10 |
| |
3.5-4.0 |
173 |
12 |
|
3.5-4.0 |
145 |
10 |
| |
2.6-2.9 |
173 |
15 |
|
2.6-2.9 |
164 |
13 |
|
Figure 5.1:
Measured transverse kinetic energy distributions of
positive and negative kaons
for the 4% and 10% most central of Pb+Pb collisions.
Two spectrometer angle settings meet at
 GeV.
The fits follow the form
GeV.
The fits follow the form
 ,
where
,
where
 .
ranges of the fits are given in Table 2 and are indicated by
the horizontal
errorbars in the inserts.
RQMD predictions for
.
ranges of the fits are given in Table 2 and are indicated by
the horizontal
errorbars in the inserts.
RQMD predictions for
 (i.e., within NA44 acceptance)
are shown as histograms.
(i.e., within NA44 acceptance)
are shown as histograms.
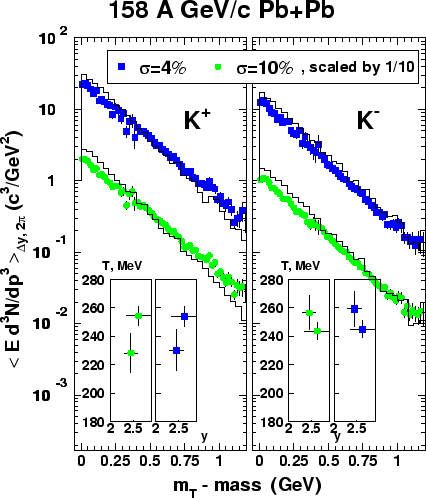 |
The  scaled spectra
appear exponential in accordance with the
behaviour typical for thermalized ensembles of interacting particles,
or for particles in whose production the phase-space constraints
played the dominant role [55].
The spectra were fit with an exponential in
scaled spectra
appear exponential in accordance with the
behaviour typical for thermalized ensembles of interacting particles,
or for particles in whose production the phase-space constraints
played the dominant role [55].
The spectra were fit with an exponential in  , and the
resulting
slopes are shown in the inserts in Fig. 5.1.
The inverse slopes of the and spectra are the same,
within errors.
Our event selection is sufficiently central that the slopes
show no dependence on multiplicity.
, and the
resulting
slopes are shown in the inserts in Fig. 5.1.
The inverse slopes of the and spectra are the same,
within errors.
Our event selection is sufficiently central that the slopes
show no dependence on multiplicity.
In Fig. 5.2, it is clear that many fewer kaons are produced than
pions, as was observed in  collisions. There are approximately twice
as many positive as negative kaons produced. This is typical for
baryon rich systems, and was also observed in collisions.
Preliminary
collisions. There are approximately twice
as many positive as negative kaons produced. This is typical for
baryon rich systems, and was also observed in collisions.
Preliminary![[*]](file:/usr/local/lib/latex2html/icons/footnote.gif) NA49 measurements of and in
[56] are consistent with those reported here.
NA49 measurements of and in
[56] are consistent with those reported here.
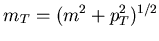
Figure 5.2:
Comparison of measured charged kaon and pion yields with RQMD
predictions.
The vertical error bars indicate statistical and systematic errors,
added in
quadrature; the horizontal ones - boundaries of the
acceptance used for  integration in each spectrometer setting.
Open symbols
represent spectrometer settings whose position is
shown mirror-reflected around midrapidity (2.92);
their solid analogs - the actual settings.
RQMD: solid line - standard mode, dashed line - no rescattering.
integration in each spectrometer setting.
Open symbols
represent spectrometer settings whose position is
shown mirror-reflected around midrapidity (2.92);
their solid analogs - the actual settings.
RQMD: solid line - standard mode, dashed line - no rescattering.
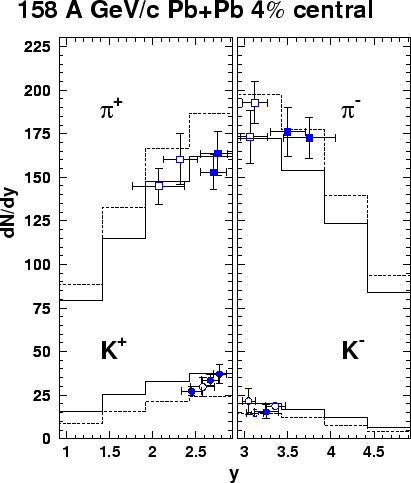 |
Both Fig. 5.1 and 5.2 compare the data with predictions of the
transport theoretical approach RQMD [57].
While RQMD tends to overpredict
both the and yields,
for the discrepancy appears to be larger.
Running RQMD in the mode which does not allow the hadrons to rescatter
(shown by the dashed line on the figure) decreases
the number of kaons produced. This result illustrates the importance
of the secondary scattering to the total kaon yields.
Measurements of proton production at midrapidity[48]
and of the  rapidity distribution[58]
indicate that RQMD somewhat overpredicts the degree of baryon
stopping.
Because
rapidity distribution[58]
indicate that RQMD somewhat overpredicts the degree of baryon
stopping.
Because  inelastic collisions can produce kaons,
an increase in stopping translates naturally into kaon enhancement
at midrapidity.
The data show that the hadron chemistry via secondary scattering, as
implemented in RQMD, successfully reproduces the general trends in the
hadron distribution. However, the hadron chemistry in the model
is not quantitatively correct.
inelastic collisions can produce kaons,
an increase in stopping translates naturally into kaon enhancement
at midrapidity.
The data show that the hadron chemistry via secondary scattering, as
implemented in RQMD, successfully reproduces the general trends in the
hadron distribution. However, the hadron chemistry in the model
is not quantitatively correct.
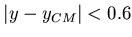
Figure 5.3:
 ratios in symmetric systems at midrapidity
 .
The solid line shows full solid angle in collisions
from the interpolation [59].
The data points from other experiments result from an interpolation
in to the midrapidity interval.
The E866 data points [60] are also interpolated
in the number of participants, for comparison with the SPS data.
.
The solid line shows full solid angle in collisions
from the interpolation [59].
The data points from other experiments result from an interpolation
in to the midrapidity interval.
The E866 data points [60] are also interpolated
in the number of participants, for comparison with the SPS data.
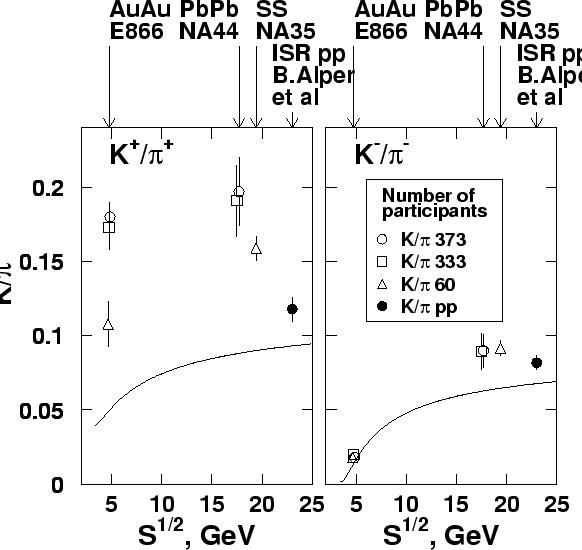 |
Strangeness enhancement compared to the interpolated
[59]  collision data, shown as the line, is seen in
Fig. 5.3.
The solid point, corresponding to ISR data at midrapidity, indicates
the extent of the enhancement due to the midrapidity cut on the
particles.
The figure shows that
collision data, shown as the line, is seen in
Fig. 5.3.
The solid point, corresponding to ISR data at midrapidity, indicates
the extent of the enhancement due to the midrapidity cut on the
particles.
The figure shows that  is enhanced in high multiplicity
heavy ion collisions, but
is enhanced in high multiplicity
heavy ion collisions, but  is consistent with
values. Higher multiplicity, or more central collisions, yields larger
enhancement, independent of
is consistent with
values. Higher multiplicity, or more central collisions, yields larger
enhancement, independent of  .
.
Secondary hadronic interactions
of the type
 are important for
the strangeness production [57,61],
and their rate is proportional
to the product of the participant's effective concentrations.
are important for
the strangeness production [57,61],
and their rate is proportional
to the product of the participant's effective concentrations.
Figure:
Comparison of measurements with RQMD predictions:
ratio in the specified rapidity
interval around mid-rapidity, as a function of the product
of pion and proton ,
obtained in the same rapidity interval, in symmetric
collisions.
 - E866 AuAu,
 - NA44 SS,
 - NA44 PbPb.
RQMD: solid line - standard mode, dashed line - no rescattering.
- NA44 PbPb.
RQMD: solid line - standard mode, dashed line - no rescattering.
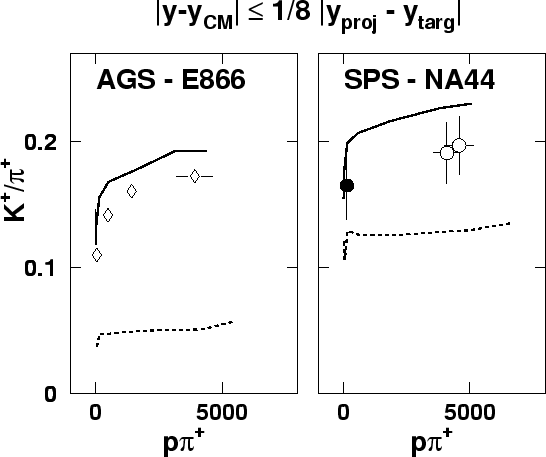 |
Fig. 5.4 shows
the dependence of the ratio on the product of rapidity
densities of the two ingredients of the associated strangeness
production,  (represented by
  )
and in the AGS [62] and SPS [63] data,
and RQMD calculations.
This ``
)
and in the AGS [62] and SPS [63] data,
and RQMD calculations.
This ``
 '' product serves as an
observable measure of the strangeness-enhancing rescattering.
The rate of change in the ratio
with this rescattering observable
is initially very high. However, nearly saturates after
this initial rise. The figure shows why the enhancement is large as
soon as the multiplicity becomes appreciable. The values of
``
'' reached at the SPS and AGS are comparable, explaining
the similarity of the kaon enhancement despite the different energies.
RQMD reproduces the trend of the data very well, and the dotted
lines (illustrating no rescattering) along with the shape of the rise
with ``
'' underscore
the role of hadronic rescattering in kaon yields. The quantitative
agreement of RQMD with the data is not as good, but the final results
are undoubtedly quite sensitive to the magnitude of the cross sections
used in the model.
'' product serves as an
observable measure of the strangeness-enhancing rescattering.
The rate of change in the ratio
with this rescattering observable
is initially very high. However, nearly saturates after
this initial rise. The figure shows why the enhancement is large as
soon as the multiplicity becomes appreciable. The values of
``
'' reached at the SPS and AGS are comparable, explaining
the similarity of the kaon enhancement despite the different energies.
RQMD reproduces the trend of the data very well, and the dotted
lines (illustrating no rescattering) along with the shape of the rise
with ``
'' underscore
the role of hadronic rescattering in kaon yields. The quantitative
agreement of RQMD with the data is not as good, but the final results
are undoubtedly quite sensitive to the magnitude of the cross sections
used in the model.
When comparing  data to , even if only particle ratios are considered,
it is important to bear in mind that there are effects which distinguish
from and which do not qualify as QGP signals.
The time interval between two
data to , even if only particle ratios are considered,
it is important to bear in mind that there are effects which distinguish
from and which do not qualify as QGP signals.
The time interval between two  interaction in the target rest frame
is of the order of
interaction in the target rest frame
is of the order of  , but due to the Lorentz time dilation,
the intermediate object created in an interaction has no time
to hadronize and is involved in the next collision and all further ones.
RQMD[57] and VENUS[64] take this into account.
Comparison to
, but due to the Lorentz time dilation,
the intermediate object created in an interaction has no time
to hadronize and is involved in the next collision and all further ones.
RQMD[57] and VENUS[64] take this into account.
Comparison to  , rather than , is more credible, but if
the intermediate partonic objects can involve constituents from
more than one projectile nucleon, a similar argument still holds.
And according to the Lorentz invariance, the intermediate partonic objects
can involve more than one projectile nucleon since,
as we have seen,
they can involve more than one target nucleon, whereas
such kind of discussion should not depend on the choice of reference
frame.
We therefore conclude that, qualitatively speaking,
a comparison with a lighter system can not be
done in a completely model-independent way, even though, quantitatively
speaking, there are different degrees of credibility among the existing methods.
In making the claim about the enhancement of (multi)strange
(anti)baryons,
WA85 compared
, rather than , is more credible, but if
the intermediate partonic objects can involve constituents from
more than one projectile nucleon, a similar argument still holds.
And according to the Lorentz invariance, the intermediate partonic objects
can involve more than one projectile nucleon since,
as we have seen,
they can involve more than one target nucleon, whereas
such kind of discussion should not depend on the choice of reference
frame.
We therefore conclude that, qualitatively speaking,
a comparison with a lighter system can not be
done in a completely model-independent way, even though, quantitatively
speaking, there are different degrees of credibility among the existing methods.
In making the claim about the enhancement of (multi)strange
(anti)baryons,
WA85 compared  with
with  [65],
NA49 -
[65],
NA49 -  with [66],
WA97 - with
with [66],
WA97 - with  system[67],
but notably, the latter experiment devoted a special paper to
the RQMD and VENUS comparisons[69].
system[67],
but notably, the latter experiment devoted a special paper to
the RQMD and VENUS comparisons[69].
Some strangeness production in RQMD
goes through the excitation of the nucleon
resonances
-
these are not considered secondaries, they
are propagated and can be re-excited and de-excited[68].
Some of their decay
channels contain strange mesons and baryons.
For this reason, there is a difference between
ratio in and ratio in RQMD without rescattering
(as seen from comparison between Fig.5.3 and Fig.5.4).
This difference looks larger for SPS than for AGS.
There are two processes in the RQMD mode without rescattering
that affect the ratio differently [68]:
- slowing down of the original nucleon as it passes through the medium.
This works to reduce ratio, compared with collisions at the
original .
- excitation of resonance nucleon states some of which
decay into
 - this enhances .
Because at the AGS energy the slowing down is significant, these two
processes tend to balance each other.
At SPS, slowing down is not so
significant, and the resonances win.
WA97 Collaboration measured yields of  ,
,  ,
,  , and
, and  (both particles and antiparticles) at midrapidity for
  and
collisions [67].
It was found that the enhancement factor with respect to is larger
for
and
collisions [67].
It was found that the enhancement factor with respect to is larger
for
 and
and  than for
 and
and  baryons.
However, the measured enhancement for antibaryons is smaller
than for baryons.
baryons.
However, the measured enhancement for antibaryons is smaller
than for baryons.
RQMD predictions for strange and antistrange baryon yields in are
available [57] to compare with.
The microscopic cascade method of RQMD does not involve the notion of
the deconfined quark-gluon soup, even though the partonic degrees
of freedom are involved via color strings and ropes.
Elastic and inelastic rescattering is simulated.
The publication [57], based on RQMD 2.1, contains predictions
for all the hyperons measured in
[67], except for and
 ,
as histograms and total number yield per central event.
With reasonable accuracy, one can draw meaningful conclusions from
comparing WA97's
,
as histograms and total number yield per central event.
With reasonable accuracy, one can draw meaningful conclusions from
comparing WA97's
 within
 around midrapidity in the most central sample
with RQMD's .
It turns out that RQMD [57]
overpredicts ,
overpredicts ,
does a good job on
around midrapidity in the most central sample
with RQMD's .
It turns out that RQMD [57]
overpredicts ,
overpredicts ,
does a good job on
 , and
considerably overpredicts
, and
considerably overpredicts  and
and
 yields reported for by the WA97 [67].
The same work includes predictions for RQMD runs with
ropes, but without rescattering, and with no ropes and no rescattering.
Whereas ropes are the main effect responsible for the birth of strange
(anti)hyperons, rescattering depletes their abundance by redistributing
(anti)strange quarks into mesons.
The latter is a generic hadrochemistry feature not unique to RQMD,
as has been discussed earlier.
yields reported for by the WA97 [67].
The same work includes predictions for RQMD runs with
ropes, but without rescattering, and with no ropes and no rescattering.
Whereas ropes are the main effect responsible for the birth of strange
(anti)hyperons, rescattering depletes their abundance by redistributing
(anti)strange quarks into mesons.
The latter is a generic hadrochemistry feature not unique to RQMD,
as has been discussed earlier.
The WA97 Collaboration made a dedicated comparison of their data
with VENUS and RQMD 2.3[69], and concluded that
VENUS[64] (based on Gribov-Regge theory with rescattering
simulation via pre-hadron clusters)
overpredicts yields of
, ,
,  and
and
 in and ,
whereas
RQMD 2.3 does a good job for , ,
,
and
, but underpredicts and
.
in and ,
whereas
RQMD 2.3 does a good job for , ,
,
and
, but underpredicts and
.
Next: Conclusion from NA44 strangeness
Up: Inclusive single particle results
Previous: Subtleties and controversies related
Contents
Mikhail Kopytine
2001-08-09