

Next: Solution
Up: Geometrical alignment of the
Previous: Geometrical alignment of the
Contents
Kopytine's homepage
An offset of the event vertex with respect to the detector's symmetry axis
results in a non-trivial functional dependence between the actual
 and
and

![[*]](file:/usr/local/lib/latex2html/icons/footnote.gif) ,
and the
,
and the
 ,
,
 presumed based on
the ``ideal'' geometry:
 ,
,
 .
This makes the observable multiplicity distribution
 (in the presumed coordinates) differ from a simple function of
 :
:
 |
(72) |
In the true coordinates  and
and  ,
the inequality 6.19 becomes an equality.
However, the detector's acceptance area in the true coordinates becomes
distorted.
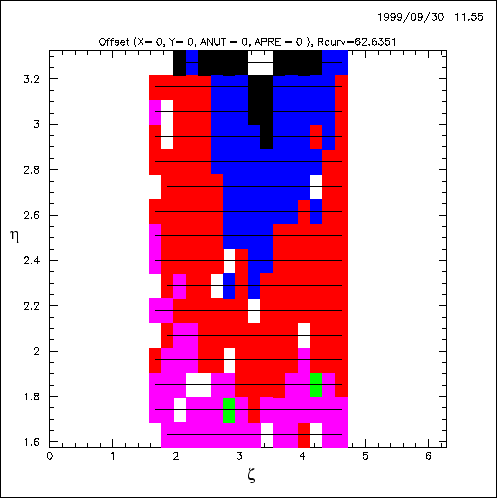
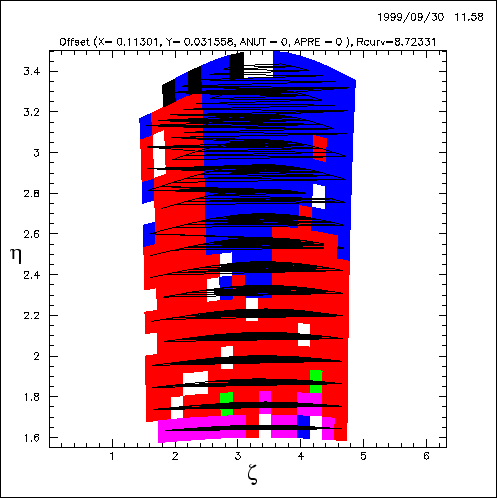
Figures 6.2 and 6.3
show the pad multiplicity (gray level) in the misaligned and aligned
coordinates, respectively.
Figure 6.2:
Example of a monitoring plot used in the course of the analysis
to understand the alignment procedure and the alignment quality.
The color (or gray level) corresponds to the pad multiplicity.
No misalignment correction is applied. The horizontal lines connect
centers of the pads with
 sufficiently small for the pairs
to be used in formula 6.20 (compare with
Fig. 6.3).
Run 3192.
The
  -contaminated part of the detector is not shown.
 |
Figure 6.3:
Another example of a monitoring plot used in the course of the analysis
to understand the alignment procedure and the alignment quality.
The color (or gray level) corresponds to the pad occupancy.
A misalignment correction is applied. One can see how both
the acceptances of the pads and their (double differential !)
multiplicities are modified.
The horizontal lines connect
centers of the pads with
 sufficiently small for the pairs
to be used in formula 6.20 (compare with
Fig. 6.2).
Run 3192.
The
  -contaminated part of the detector is not shown.
 |
In the following we will refer to this as a ``Jacobian effect''.
The Jacobian effect, obviously, contributes to the event textures,
especially on the large scale, and needs to be evaluated and corrected for.


Next: Solution
Up: Geometrical alignment of the
Previous: Geometrical alignment of the
Contents
Mikhail Kopytine
2001-08-09
![]() and
and
![]()
![]() ,
and the
,
and the
![]() ,
,
![]() presumed based on
the ``ideal'' geometry:
presumed based on
the ``ideal'' geometry:
![]() ,
,
![]() .
This makes the observable multiplicity distribution
.
This makes the observable multiplicity distribution
![]() (in the presumed coordinates) differ from a simple function of
(in the presumed coordinates) differ from a simple function of
![]() :
:

