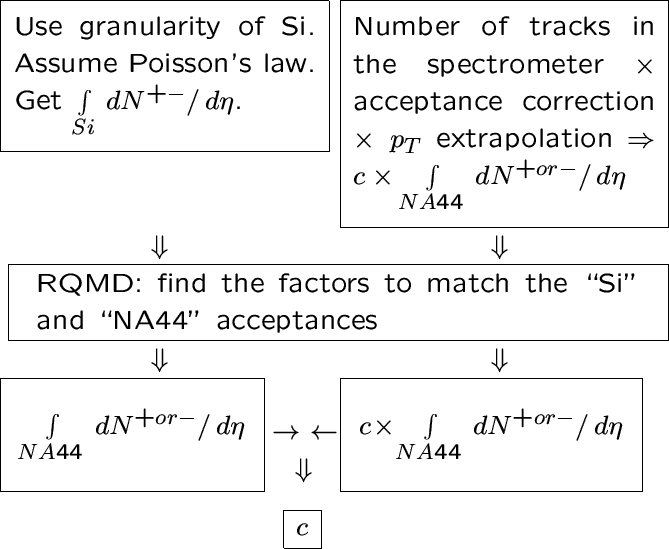
This subsection explains the core procedure of centrality
determination.
It consists in finding the number ![]() which gives the closest match
between the Si and the spectrometer data, and is illustrated by the
chart in Fig. 4.3.
which gives the closest match
between the Si and the spectrometer data, and is illustrated by the
chart in Fig. 4.3.
 |
In my method I scan correlation between the normalized (under some tentatively
assumed trigger
centrality) spectrometer ![]() of non-identified
tracks and the Si
of non-identified
tracks and the Si ![]() .
Acceptance correction for the non-identified spectrometer tracks is described
in subsection 4.1.4.
The spectrometer
.
Acceptance correction for the non-identified spectrometer tracks is described
in subsection 4.1.4.
The spectrometer ![]() is corrected for the inefficiencies
due to dead channels, presence of the
pad chamber in the trigger, tracking confidence level cuts,
and includes extrapolation to
is corrected for the inefficiencies
due to dead channels, presence of the
pad chamber in the trigger, tracking confidence level cuts,
and includes extrapolation to
![]() .
The correlation is scanned varying the T0 multiplicity, with 14 fixed T0
thresholds.
The centrality that makes spectrometer and Si
.
The correlation is scanned varying the T0 multiplicity, with 14 fixed T0
thresholds.
The centrality that makes spectrometer and Si ![]() match with the factors shown in the Table 4.3 is accepted.
An example of such centrality fitting is illustrated by Fig.
4.4 and Fig. 4.5.
match with the factors shown in the Table 4.3 is accepted.
An example of such centrality fitting is illustrated by Fig.
4.4 and Fig. 4.5.
 |
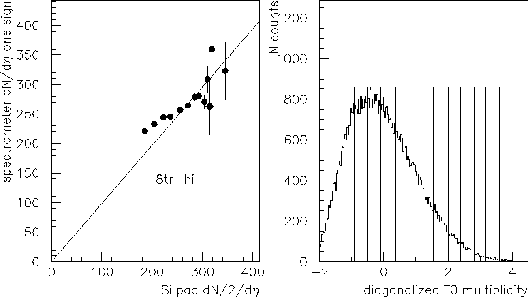
Shown in the right part of Fig. 4.4 is the
``diagonalized'' T0 distribution from two PMT tubes on the ![]() -free side.
(The ``diagonalization'' means that distributions from two tubes on
the
-free side.
(The ``diagonalization'' means that distributions from two tubes on
the ![]() -free side were gainmatched, the covariance matrix that
describes their correlation was diagonalized, and the value
plotted is the diagonalized coordinate which is correlated with multiplicity.
The zero of the normalized unit is chosen at the mean vealue
of the distribution.)
The points shown correspond
to 14 centrality bins with boundaries 0, .0001, .0002, .0005, .001, .0025,
.005, 0.01, 0.02, 0.04, 0.06, 0.08, 0.10, 0.12, 0.14,
later referred to as
-free side were gainmatched, the covariance matrix that
describes their correlation was diagonalized, and the value
plotted is the diagonalized coordinate which is correlated with multiplicity.
The zero of the normalized unit is chosen at the mean vealue
of the distribution.)
The points shown correspond
to 14 centrality bins with boundaries 0, .0001, .0002, .0005, .001, .0025,
.005, 0.01, 0.02, 0.04, 0.06, 0.08, 0.10, 0.12, 0.14,
later referred to as ![]() .
Of course, the thresholds
.
Of course, the thresholds ![]() change with
different values assigned as the overall trigger centrality.
The vertical lines across the T0
distribution in the right panel of Fig. 4.4 show locations of the
thresholds which maximize the correlation in the left panel.
change with
different values assigned as the overall trigger centrality.
The vertical lines across the T0
distribution in the right panel of Fig. 4.4 show locations of the
thresholds which maximize the correlation in the left panel.
 |
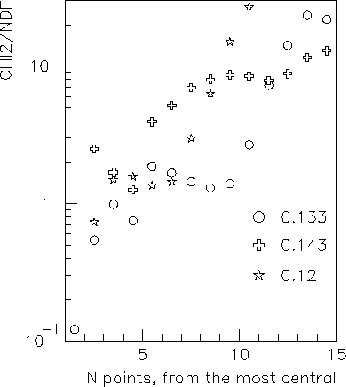
Fig. 4.5 justifies why the correlation on Fig. 4.4
was found to be maximized by the centrality chosen.
It shows the ![]() (per number of degrees of freedom) between each of three
possible correlations and the one expected on the basis of acceptance simulation (see Table
4.3), vs the number of points involved.
Data for three close choices of centrality are shown, the best choice
is the one plotted by
(per number of degrees of freedom) between each of three
possible correlations and the one expected on the basis of acceptance simulation (see Table
4.3), vs the number of points involved.
Data for three close choices of centrality are shown, the best choice
is the one plotted by
![]() .
.
The trend present on
most figures like Fig. 4.4, left,
(analyzed separately for every spectrometer setting)
is a flattening
of the correlation slope for lower multiplicity bins,
as compared to a perfect correlation,
especially for those bins
where central T0 distribution deviates
significantly from the valid beam![]() one.
The centrality thresholds are chosen based on the interpolation of
the integrated T0 amplitude distribution
one.
The centrality thresholds are chosen based on the interpolation of
the integrated T0 amplitude distribution ![]() ,
,

| (28) |
From this it is clear that the bins to the left of the maximum in ![]() contain a broader composition of true
centralities.
However, the correlation in
contain a broader composition of true
centralities.
However, the correlation in ![]() between the Si and the spectrometer
holds as long as the tracks in the numerator of equation (4.16)
come from events which are unbiased representatives of their centrality class.
Recall here that both T0 and spectrometer, but not the Si, enter the trigger.
Can we hope that the events in question are unbiased in this sense ?
No, the bin contents to the left of the maximum in
between the Si and the spectrometer
holds as long as the tracks in the numerator of equation (4.16)
come from events which are unbiased representatives of their centrality class.
Recall here that both T0 and spectrometer, but not the Si, enter the trigger.
Can we hope that the events in question are unbiased in this sense ?
No, the bin contents to the left of the maximum in ![]() are the
ones which deviate from the minimum bias T0 distribution the most !
Selection of these events is obviously the most affected by the
trigger requirement of a spectrometer track.
This explains why the correlation flattens out, i.e. the Si
are the
ones which deviate from the minimum bias T0 distribution the most !
Selection of these events is obviously the most affected by the
trigger requirement of a spectrometer track.
This explains why the correlation flattens out, i.e. the Si ![]() drops faster than the ``same'' quantity from the spectrometer.
drops faster than the ``same'' quantity from the spectrometer.