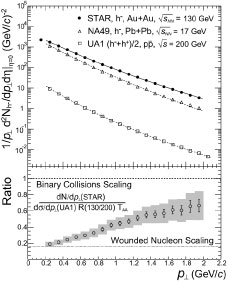
Figure. Upper panel: h- pT spectra for the 5% most central Au+Au collisions at midrapidity (|eta| < 0.1) for several systems. The curves are power-law fits to the data. Lower panel: ratio of STAR and scaled UA1 pT distributions. Return to text
Figure. Upper panel: h- pT spectra for the 5% most central Au+Au collisions at midrapidity (|eta| < 0.1) for several systems. The curves are power-law fits to the data. Lower panel: ratio of STAR and scaled UA1 pT distributions.
Return to text